More than two-thirds of CIOs believe that the rise of Kubernetes has brought in many moving parts for IT teams to manage. There’s a serious need for a transformational approach to IT and cloud operations management. – 2020 Global CIO Report.
It’s no surprise that Kubernetes became the developers’ apple of the eye due to its exceptional ability to keep the container workloads up and running. However, its dynamic nature also gave rise to an increased number of problems for platform engineers who needed to keep track of its performance despite the pace. This dilemma inspired Kubernetes Observability; it allowed organizations the efficient use of Kubernetes, better visibility into the ecosystem, and complete focus on continuous innovation.
What sorcery is this?
It’s a simple approach with a few nuances you need to understand to implement in your organization. So let’s start with the basics.
What is Kubernetes Observability?
Observability, in its simplest form, refers to the potential to measure the current state of a system based on the generated data, including logs, metrics, and stack traces.
However, conventional observability tools were built to check monolithic systems’ health and behavior.
Therefore, they are incompatible with distributed and complex architectures like Kubernetes, wherein the architecture constantly changes, with multiple Kubernetes pods being simultaneously created and destroyed within minutes. Due to the dynamic and ephemeral nature of Kubernetes, pre-defined logs and metrics aren’t adequate enough to deal with troubleshooting problems.
As a result, adopting a tailored solution built for a distributed microservices architecture is ideal. Such a solution should match the inconsistent nature of Kubernetes and collect data that will help your teams identify and troubleshoot errors in real-time.
Observability vs. Monitoring: How are they different?
These two are often used interchangeably; however, they are different in their application. By monitoring Kubernetes, you can verify if the Kubernetes environment and its clusters, nodes, containers, pods, and Kubernetes workloads running and functioning as expected. On the other hand, observability provides you with a comprehensive picture and vital information to take steps towards improving performance and making the application, K8s components, and the entire underlying infrastructure more stable and resilient.
For instance, Prometheus – a popular Kubernetes monitoring tool, enables real-time monitoring, and alerting, checks the symptoms, and notifies your teams about the anomalies. A Kubernetes observability tool helps generate broad overviews and comprehensive summaries of the application performance and provides ways to connect changes in the metrics with Kubernetes events.
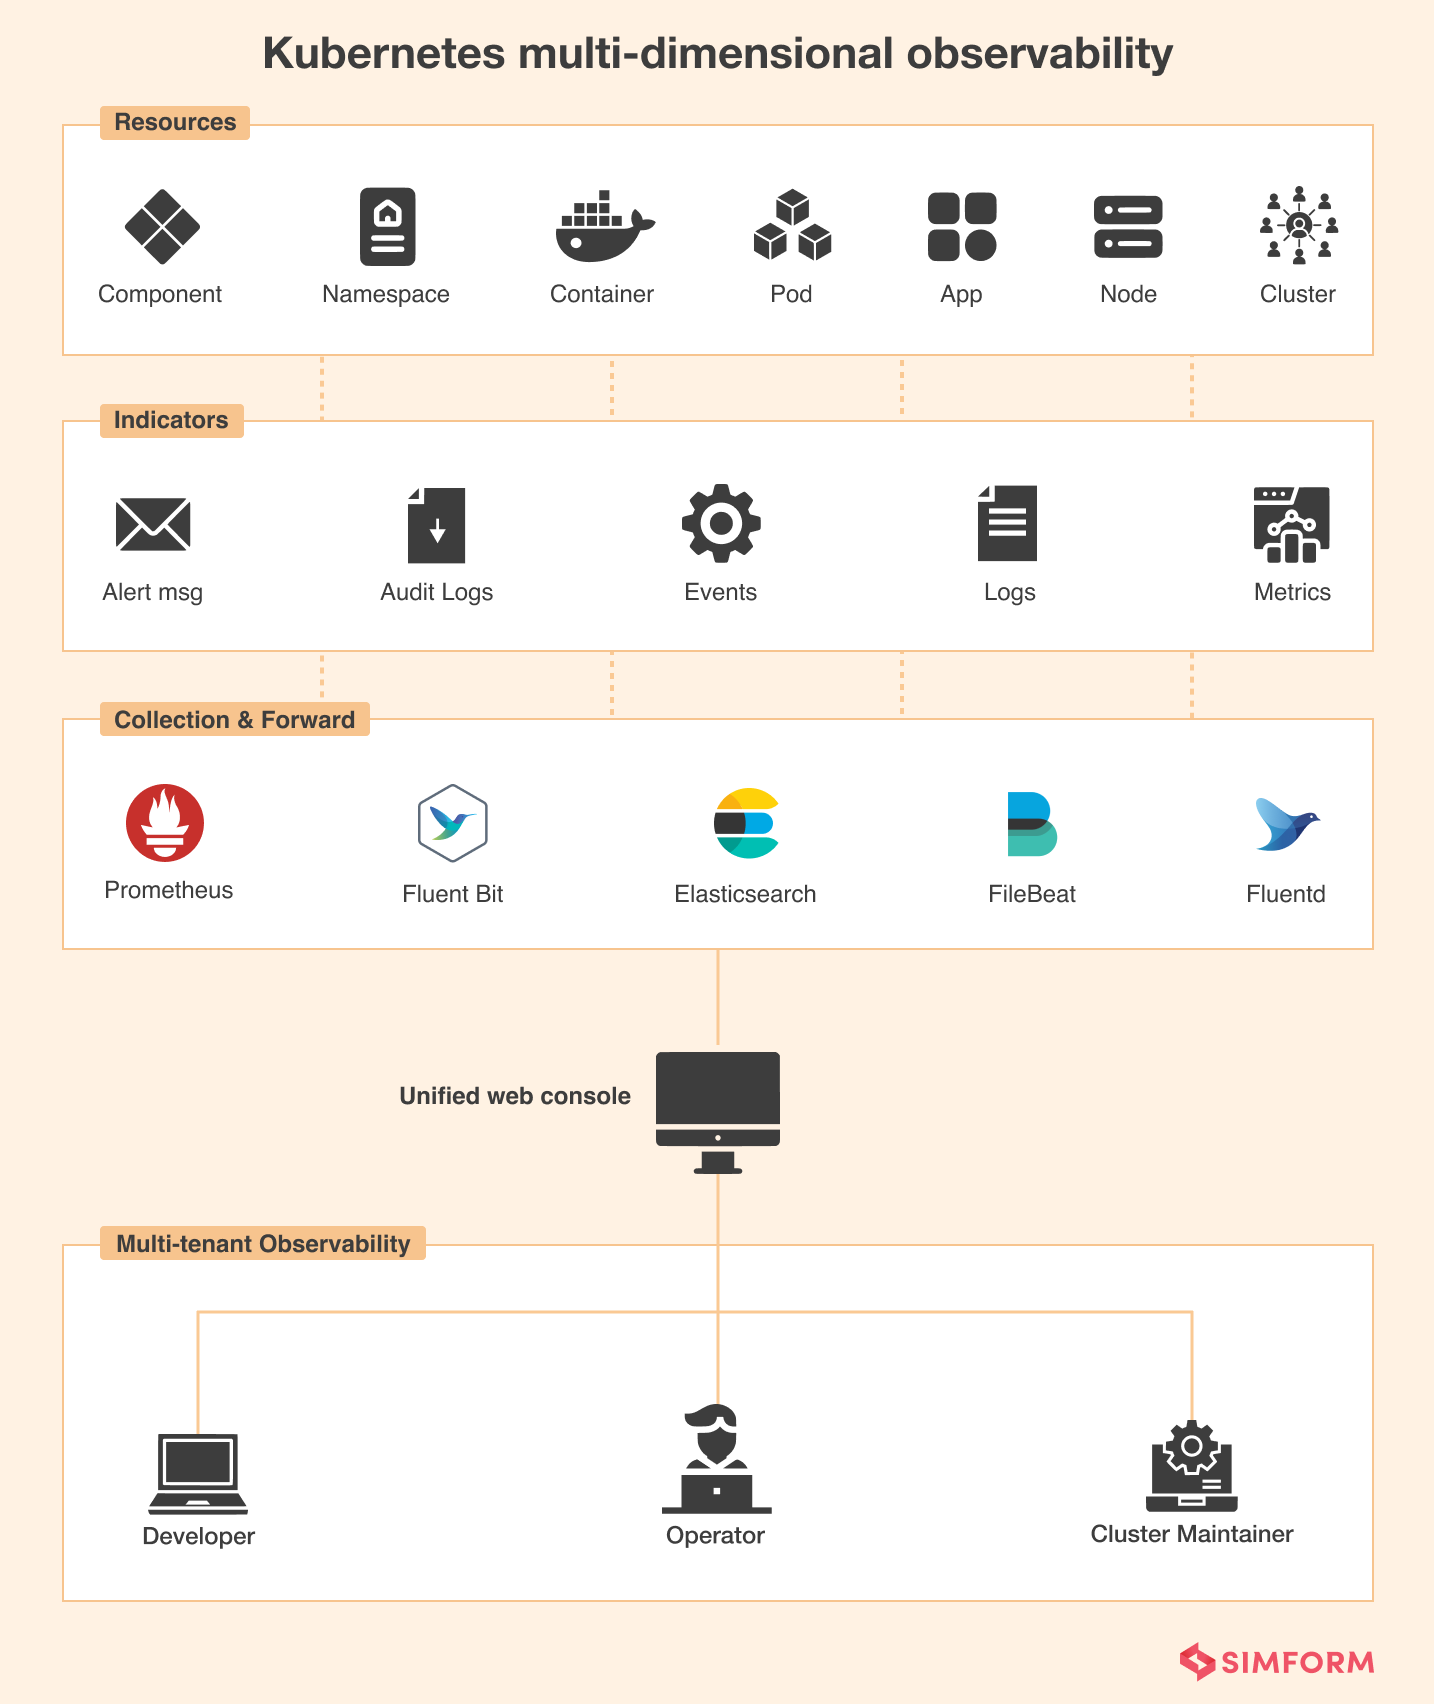
Over the years, Kubernetes has become a developer’s choice for designing and deploying scalable and distributed containerized applications. However, Kubernetes is unaware of the internal state of an application. Therefore, developers and SREs leverage telemetry data (logs, metrics, and traces) to understand how their code behaves during runtime. These are known as the three pillars of Kubernetes observability.
Understanding the three pillars of Kubernetes Observability
- Logs are files that store events, warnings, and errors occurring in the software environment. They generally contain contextual information, like the specific time of an event and the user or endpoint connected with it. The log messages present data points in plain text, either structured or binary format. But, it’s important to keep in mind that log messages need a vast amount to store; therefore, you must assess your storage strategy before generating them.
- Metrics are numerical data representations reported over a specific period of time. They help to determine the overall system health and obtain actionable insights with telemetry signals. These metrics are usually stored in time series data stores like Prometheus and can be optimized to store, compress, or process as per need. Metrics are better than logs in one aspect – they can be easily retrieved and queried, which makes them perfect for alerting and creating dynamic dashboards. With the help of these Kubernetes dashboards, you can view the system’s real-time and historical data.
- Traces represent consequent events. Such events demonstrate an end-to-end request path of a distributed system. If your team understands the request flow, troubleshooting performance bottlenecks and identifying dependencies between various services running in an ecosystem is comparatively less complicated.
Although implementing observability in Kubernetes offers exceptional benefits to your applications running on the cloud; there are a few roadblocks you’ll have to overcome to make it a smooth process.
Challenges in implementing Observability for Kubernetes
-
Dealing with data silos
Conventional monitoring tools are built to collect metrics at an infrastructure and application levels. However, since Kubernetes is dynamic, ephemeral, and distributed in nature, the collection style of these tools creates data silos. Moreover, when DevOps include more metrics for observation, data silos can lead to uneven cross-references and data misinterpretation, leading to slower communication and error-prone analysis.
-
Managing large volumes of data
Kubernetes Deployment depends on different components like pods, containers, and microservices. Moreover, these components are a part of the ephemeral and distributed infrastructure. As a result, the entire system generates a great volume of data at each layer, and it keeps increasing with the multiplying scale of services. It becomes difficult to track patterns and follow debugging, making observability and troubleshooting all the more complex.
-
Keeping up with the dynamic nature of Kubernetes
It’s no secret that Kubernetes clusters are complex and constantly evolving. The container instances will go up and down as the demand fluctuates. Or the estimates between storage limits and containers running are subject to change depending on the storage needs. While the traditional approach to infrastructure management was fixed, Kubernetes mixes up the resources unimaginably. Therefore, the logs, traces, or metrics collection accumulated at one point may not resemble the same ones or logs at another time. Similarly, the configurations for log and metric streams will change periodically.
A best practice is to maintain observability in real-time and keep the historical observability data as a reference to let your teams get insights into the system, even if the existing state of clusters or resources is different.
Top 3 approaches to tackling observability challenges
Maintaining adequate visibility is no less challenging as cloud-native environments continue to help businesses evolve and drive customer experience success. Kubernetes is undoubtedly a great aid; however, its dynamic abstraction layer gives birth to new errors and makes it difficult to identify, troubleshoot, and prevent errors. Here are 3 tried and tested practical approaches to implementing observability in Kubernetes.
-
Leverage AIOps and automation
By now, we know how dynamic Kubernetes is and how its clusters, specific pod, and node availability keep changing continuously. However, this changing nature can leave software development teams struggling to gain insights into the overall health of the application running and keep up with the pace of their Kubernetes environments. As a result, they divert their focus toward these mundane tasks and overlook building new services for their business.
Leveraging continuous automation powered by AIOps allows teams (platform and application developers) to stay on top of massive environments – even with a million changes in real-time. It also enables them to continuously monitor the system for downtime and performance abnormalities.
Another significant advantage of AIOps is getting a complete overview of the Kubernetes environments and scheduling tasks by understanding which changes are bound to affect the business the most. Therefore, your teams can foresee the factors impacting the user experience and repair them in time.
-
Practice data correlation
Kubernetes observability isn’t just about collecting and analyzing logs, metrics, and traces from different components of your cluster; it has to be contextualized with every event based on how the rest of the cluster functions at the event’s time. It also involves what happens after the event occurs.
Moreover, looking at it in the user’s context is crucial with so much data at hand. Typically organizations allow teams access to only the backend picture and fail to show the impact of Kubernetes performance on business outcomes. Therefore, your teams must correlate between the codes pushed into production, the backend, and the frontend. One way to achieve this is by attaching Kubernetes monitoring data with your real-time metrics like insights on general user experience and conversions.
-
Encourage a full-stack approach to the environment
Typically, teams deploy Kubernetes across different environments as K8s run on any cloud computing enviornment and give organizations the liberty to deploy microservices across multiple platforms and leverage managed services like EKS, GKE, and AKS. Also, every organization adopts a different monitoring tool or cloud services to manage their Kubernetes environments. Therefore, collecting data from all these sources can be extremely time-consuming and create silos among teams.
A solution to this problem is breaking down the silos between teams. The first step is to gather all the metrics, logs, and traces on one platform using a common data model. This data should also include information about traditional services and tech stacks, so your teams can view data across the entire environment in a single structure.
You can adopt all the best practices, follow every rule in the book, and still make errors. While the error may vary per the team structure and its development approaches, here are 3 mistakes you must avoid.
Pitfalls to avoid while implementing Kubernetes observability
-
Avoid aggregating your logs
Observability may look like simply collecting all the log data from master nodes, worker nodes, containers, and physical infrastructure and then aggregating it all to believe that it will offer complete visibility of the Kubernetes ecosystem you need. Sadly, it is not.
Each component in your cluster records different kinds of information at various rates. Therefore, your aggregated data will not show how a pod crashed and its other relevant details. These details may have appeared in another component earlier, but you won’t see the information of a single event in these aggregated logs.
-
Reduce dependability on managed Kubernetes service
Whether it’s Amazon Kubernetes Service or Azure Kubernetes Service, these managed services cannot replace a systematic observability roadmap. These services will provide a simple alerting mechanism and a monitoring system and give you information about serious anomalies but don’t educate you about complete performance management. Therefore, you must prioritize collecting, correlating, and analyzing information to understand how the system performs compared to its predecessor.
-
Don’t restrict observability to only metrics
The Kubernetes metrics API can help you collect metrics data that ensure across-the-board visibility into a cluster, including crucial data from CPU and memory usage. However, collecting only the cluster-level data will not give you the detailed insights necessary to get the best observability and understand the current state of your cluster. Therefore, correlating data of different kinds across the cluster is vital in looking at what’s happening with the system as a whole.
We saw the challenges, best practices, and potential mistakes of Kubernetes observability. It is time to check out some tools that make this process seamless and less tiring for your teams.
Popular tools you can leverage for implementing Observability
Fluentd
It is an open-source data collector tool that unifies logging layers. Some of its key features include-
- Combines well with Kubernetes when run as DaemonSet. It allows all nodes to run a copy of each pod.
- Supports multiple data output plugins. It helps to export logs to third-party apps.
- Fluentd agent ensures everything is well-distributed to a central logging point.
Jaeger
It’s an open-source distributed tracing system built by Uber. The tool is developed to monitor and repair distributed microservices. Some of its key features include-
- Provides client libraries for top programming languages like Java, Go, and Python.
- Jaeger Operator helps deploy Kubernetes and enables deploying and managing Jaeger instances.
- In-depth root cause analysis and performance analysis.
Prometheus
It’s a cloud-native data store based on time series. Prometheus is an open-source project from the Cloud Native Computing Foundation developed with a rich query language for metrics. Some of its key features include-
- Runs in Kubernetes, either in stand-alone mode or with a Kubernetes Operator.
- Leverages exporters to merge third-party data into its data store.
How to choose Kubernetes observability tools?
Choosing the right Kubernetes observability tools can be a crucial decision to ensure effective monitoring and troubleshooting of your Kubernetes environment. Here are some factors to consider when making your selection:
- Requirements: Define your requirements and goals for observability. Consider factors such as monitoring, logging, tracing, and metrics collection. Determine what data you need to collect and analyze, as well as the level of visibility required.
- Scalability and performance: Ensure that the tools can handle the scale of your Kubernetes cluster and support the number of Kubernetes nodes, pods, and services your systems have.
- Data collection: Assess how the tools collect and store data. Look for features like automatic data collection, support for different data formats, and compatibility with your existing logging and monitoring systems. Consider the storage requirements, including retention policies and data lifecycle management.
- Visualization and dashboards: Evaluate the tool’s ability to present data clearly and intuitively. Look for user-friendly, customizable dashboards that provide meaningful and actionable insights along with visualizations.
- Alerting and notification: Check if the tools offer flexible alerting mechanisms to notify you of any issues or anomalies. Ensure they support various notification channels like email, SMS, and chat platforms and offer flexibility in configuring alerts and notifications.
- Integration and compatibility: Ensure that the observability tools you choose are compatible with your Kubernetes deployment. Check if they support the Kubernetes monitoring framework your systems use, and if they can integrate with other essential components like container runtimes, service meshes, and logging frameworks.
- Community and support: Evaluate the community around the observability tools. Check for active development, documentation, and user communities that can provide assistance and share best practices. Consider the availability of support options, such as official support channels, forums, or community-driven resources.
- Cost and licensing: Evaluate the tools’ pricing model and licensing terms. Consider upfront and ongoing maintenance expenses to ensure they align with your budget.
Wrapping up
After going through every aspect of Kubernetes Observability in this blog post, it’s clear that implementing it can bring significant benefits to how you handle your applications and how it affects your business. However, implementing it is no child’s play. Especially if your team has never worked with Kubernetes Observability before. Well, no worries.
With our expertise in digital product engineering, Simform offers comprehensive consulting services to help you adopt the technology to make the most out of it. Our Kubernetes experts are skilled in building a customized roadmap for your organization without affecting your business. Connect with us today to know more about our services!
