Monitoring systems have been became a part of the IT industry for a while now. It all started with the era of monolithic applications when monitoring was about applications’ availability. However, when cloud-based apps became the norm, APM (Application Performance Monitoring) came into use to monitor performance for the best user experience in modern computing.
After the IT world moved to cloud-native apps, there was a need for a paradigm shift, which came as observability. It gave IT teams visibility into the infrastructure, application, and whole development pipeline. This article will take you through the evolution of IT monitoring from traditional APM to enterprise observability.
Why was traditional APM necessary?
In today’s day and age, people’s lives revolve around applications. So, if your application provides a poor user experience, it won’t survive in today’s highly competitive digital space. To resolve that issue, you need to monitor application performance continuously. It was massively challenging, especially in the era of distributed computing with so many different components.
APM came to the forefront as a perfect solution, providing a unified view across your entire application stack, including every component, dependency, and user interaction. In a distributed computing scenario, you tend to miss real-time insights. However, with APM, you have visibility over all components, helping you detect and proactively resolve performance issues.
Application Performance Monitoring (APM) is the practice of tracking application performance using monitoring and telemetry data points. It ensures system availability, optimizes service performance and response times, and improves user experiences.
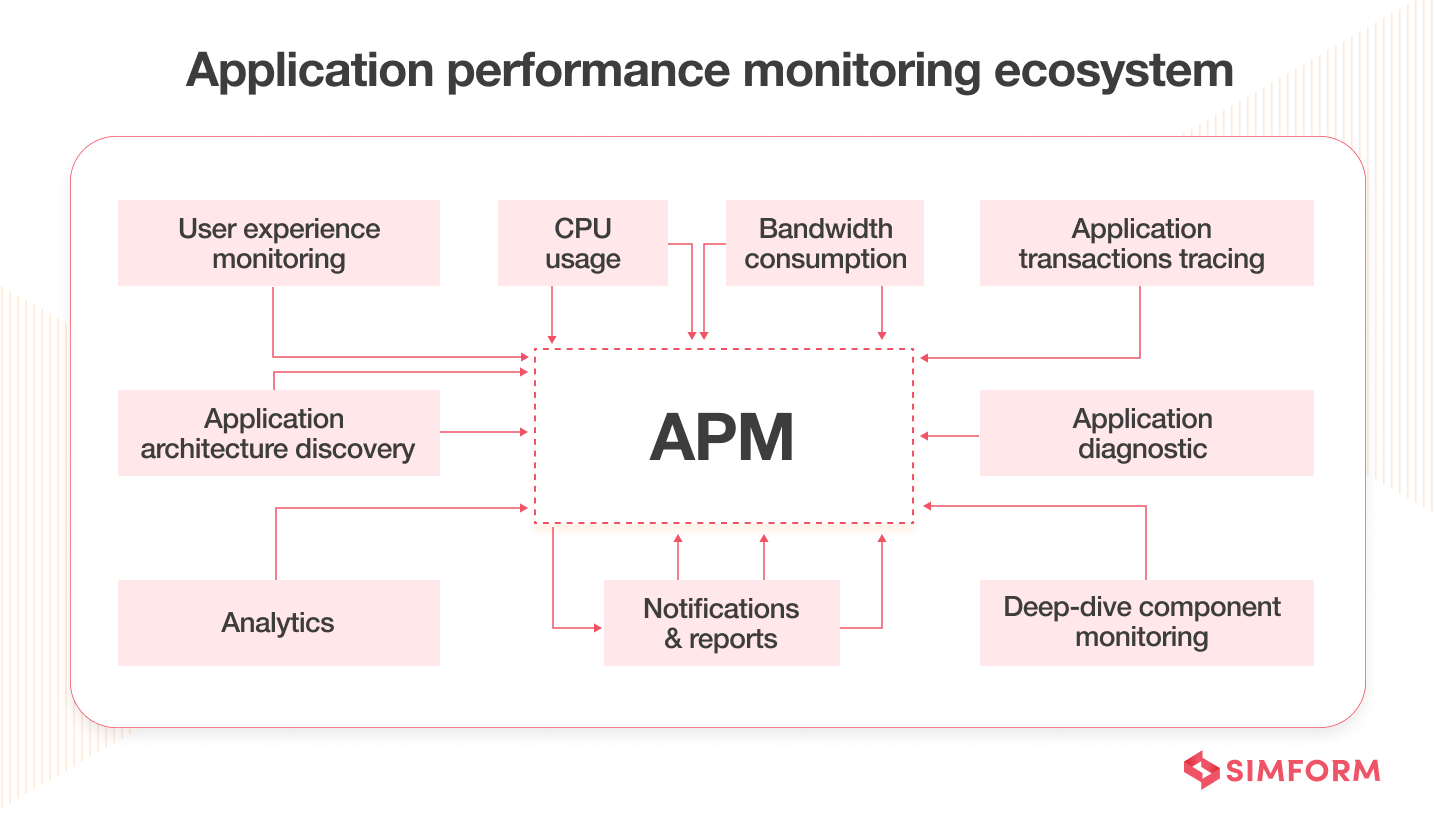
The APM ecosystem has five major components:
- Runtime application architecture: Analyze hardware and software components used in application execution.
- Real user monitoring: Gathers user data to understand their behavior pattern and how it impacts application performance.
- Business transactions: Focuses on user interactions and recreates those scenarios to understand the conduction that leads to performance issues.
- Component monitoring: Tracks all the components of IT infrastructure.
- Analytics and reporting: Translates raw data into meaningful information to define a performance baseline and identify issues.
Alaska Airlines is one of the most popular airline services. E-commerce teamwork in a demanding, complex, and data-rich environment. Also, it has a reputation for having stellar customer service. There’s no room for error, whether providing guests with seamless ticket search, travel booking, check-in, or flight notification functionality.
So, when Alaska Airlines embraced digitization, they wanted to get full-stack visibility into complex hybrid cloud environments. The purpose was to derive insights that would help minimize costly performance issues. So, Alaska Airlines opted for the APM solution. It allowed Alaska Airlines to get a holistic view of its ecosystem and determine the root causes of issues. It resulted in a 60% reduction in outages, and MTTR went down from an hour to 10 mins.
Here are some of the benefits that APM tools can provide for IT teams:
- In-depth visibility into application performance
- Detection and prevention of significant issues
- Reduced wastage of time and optimized resource utilization
- Empowerment of IT teams to work more efficiently
- Quick identification of the root cause of problems
- Better understanding of interconnected components in your app environment
- Actionable insights
- Faster app launches
However, with the advent of cloud computing services a few years later, APM didn’t satisfy the needs of IT teams anymore. It brought a variety of components and modernized the application stack.
What are the 6 key challenges with traditional APM solutions
There is an old saying that change is the only constant.
When cloud computing came into the picture, it brought microservices, multicloud strategies, containers, Kubernetes, and serverless computing. These components led to multiple challenges for APM.
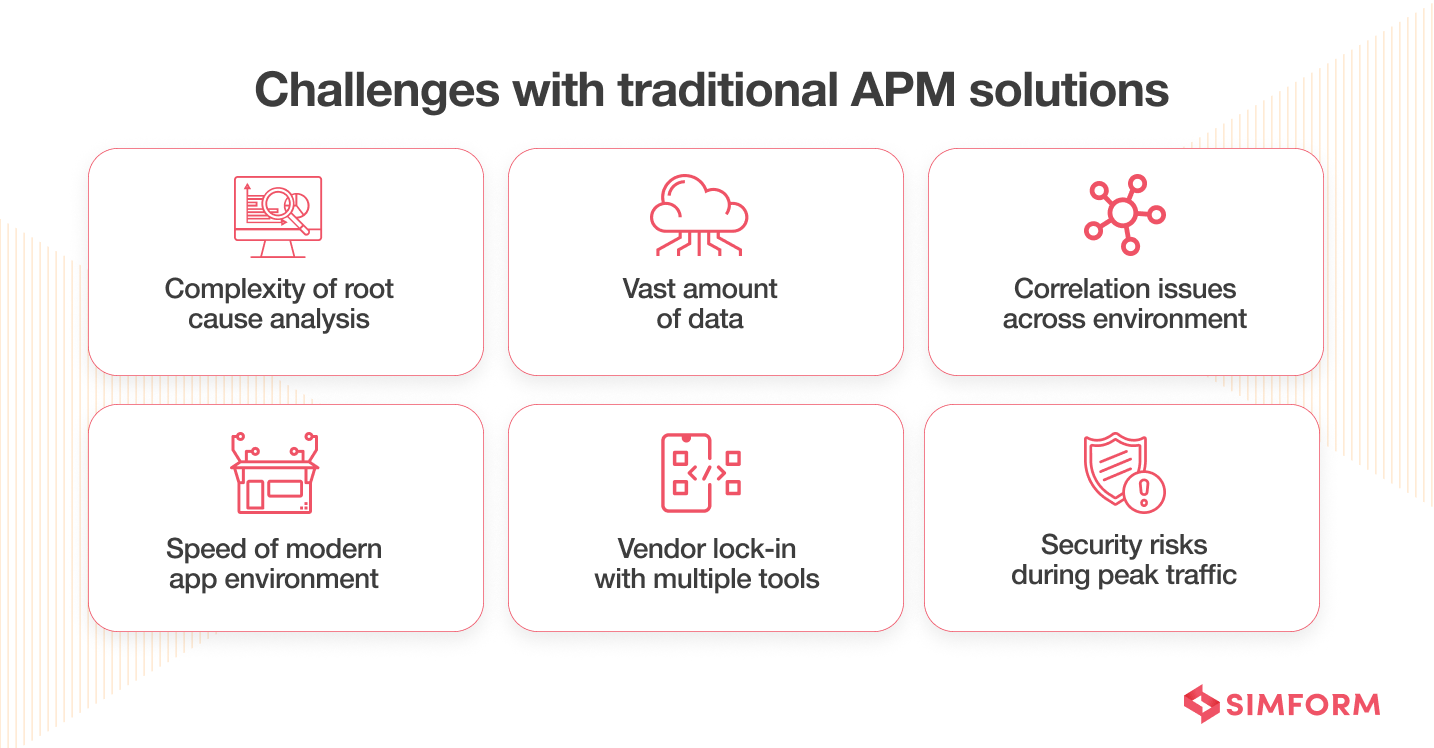
Challenge 1: Complexity of root cause analysis
Modernized applications have many interconnected components that introduce complex interdependencies. In this scenario, finding the root cause of an application crash or problem becomes a massive challenge.
APM tools work well when you want to deal with application performance and alert you whenever there are issues. However, it can’t see beyond the app level and find underlying issues at the infrastructure level. So, for cloud-native environments, where many interconnected components and infrastructure-level problems can arise, APM wasn’t a comprehensive solution.
Challenge 2: A vast amount of data to handle
When you make an application that involves components such as microservices, containers, serverless computing, etc., it aims to break down apps into smaller chunks. These introduce a vast amount of data, and identifying what is essential gets tricky.
IT teams often get flooded with massive datasets caused by several incidents. They cannot process these monitoring data with traditional APM solutions, thereby decreasing the team’s productivity.
Challenge 3: Correlating issues across the environment
Applications, infrastructure, and services are interconnected. So, the health of one component may have an impact on the other. Therefore, having full-stack visibility among the various dependencies is paramount.
APM solutions can’t trace application dependencies of networking, neighboring VMs, hosts, or storage. Therefore, if an application has bottlenecks within infrastructure, APM tools will alert only about the issues. However, since it doesn’t have full-stack infrastructure visibility, it can’t give you reasons as to why the issue cropped up.
Challenge 4: Speed of modern application environment
In today’s age of CI/CD (Continuous Integration/Continuous Deployment), the application environment keeps changing rapidly. There is no static state which you can take as a reference to monitor the application performance.
The traditional APM tools can’t keep pace with faster deployments. So, it takes too long before the issues get detected. By the time IT teams decide to solve the problems, application environments have changed.
Challenge 5: Vendor-locking of various tools
You have various monitoring tools with many interdependent components on your plater in a modernized application environment. There are usually 6-10 tools in a complex application environment to monitor various elements. The problem with all these tools is that they come with vendor lock-in.
So, when the application grows, and you want them to scale up, you either have to pay extra money or use the tools with restrictions. There is no cohesive plan of how these different tools can work together under one umbrella ecosystem. This propagation of fragmentation in APM tools also introduces licensing issues that prevent the IT teams from achieving their goals.
Challenge 6: Security risks during peak traffic
APM tools rely on detecting anomalies in data sources by having visibility into the application infrastructure for proactive monitoring. These data include logs, traces, memory metrics, CPU usage, etc. For example, applications will get flooded with massive traffic during festivals like Black Friday or Christmas.
However, the traditional APM tools don’t have the capabilities to identify whether the traffic spikes are seasonal or due to DDoS (Distributed Denial of Service) attacks. It creates an opportunity for the attacker to put application security at risk.
The above discussion shows that conventional APM solutions can’t work in today’s app environment. You need a modernized APM solution or an evolved version of it.
Start a Successful DevOps Partnersip with Us
The move to observability: Evolving APM for the modern environment
At one point, traditional APM solutions were the best possible option to gain visibility into the application’s performance. However, measuring a handful of KPIs in today’s complex environment is not enough. You need a monitoring system that insights into the entire delivery pipeline’s health.
The monitoring system needs to be dynamic and should be able to bring data from various systems to help the multiple teams involved in development. These requirements led to a gradual shift from APM to observability. Observability is an evolved version of APM and has monitoring capabilities that align with the needs of modern environments.
From monitoring to observability in three generations
Monitoring and observability are related but not the same. We have understood the theoretical part of how IT monitoring evolved from APM to observability. However, let’s focus on the practical side and understand how the shift from monitoring to observability happened across three generations.
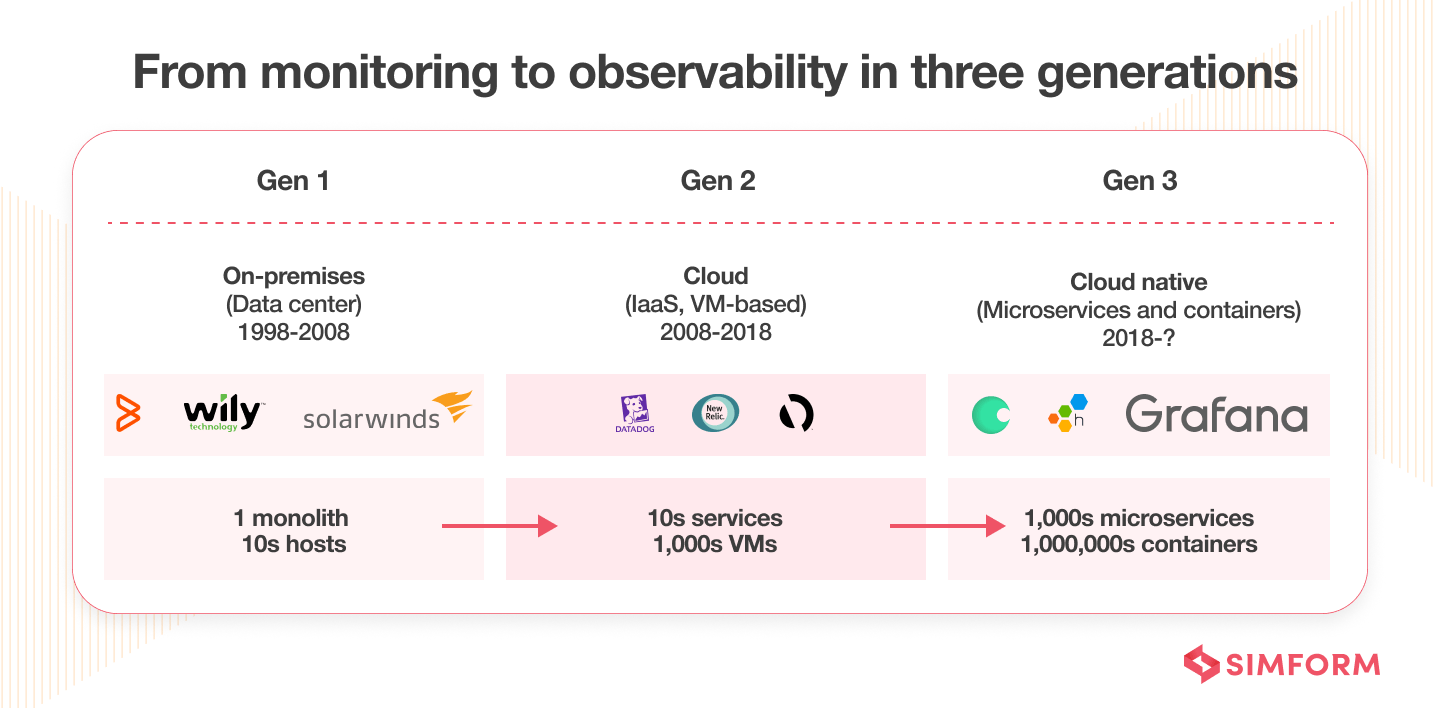
Generation 1: On-Premise Data Center (1998-2008)
Between the late ’90s and late 2000s, IT applications relied on on-premise data centers. At that point, monitoring the system meant checking the status of physical servers, storage, and networking. The era was of monolithic applications, and there were no interconnected components. The current status of the elements gives an idea of whether your applications are working correctly or not.
Generation 2: Cloud Computing (2008-2018)
By the end of 2008, cloud computing came into existence. It was a significant paradigm shift in how IT teams managed application performance. APM tools came into existence to monitor these cloud-computing applications. The tools provide visibility into the performance and availability of thousands of VMs running the application. With better insights into availability and performance, it was possible to determine whether cloud-based applications are working correctly or not.
Generation 3: Cloud-Native and DevOps (2018-Present)
By the end of the 2010s, cloud-native applications became the norm. Traditional APM tools were not enough to monitor such applications anymore. The rise of DevOps, microservices, containers, and serverless computing came with a new set of complexity and challenges. Observability was now the next stage in evolution to ensure apps perform at their optimum best.
What is observability?
Observability is the use of software tools and practices for aggregating, correlating, and analyzing performance data in a cloud-native environment. With the help of observability, you can monitor, troubleshoot and debug the application to meet customer experience expectations.
Like traditional APM solutions, observability also provides insights into what’s happening inside the application. However, the core difference is that observability focus on the overall health of the IT system, while APM focuses on application performance KPIs.
Observability for a single application differs significantly from that for an entire enterprise. Let’s understand what it is all about.
What is enterprise observability?
It is the technique of translating the observability concept for enterprise or large-scale business environments. Therefore, it focuses on optimizing the entire IT environment and not on managing the health/performance of individual apps.
Enterprise observability aims to combine the best of two worlds to detect and resolve application performance issues quickly-
- The breadth of observability – the extensive coverage or scope as it provides visibility not limited to the app but the delivery pipeline and infrastructure.
- The depth of APM – monitoring data we get through metrics, logs, and traces.
Combining both means retrieving relevant data from each component and processing them to provide actionable insights to the IT team to make informed decisions.
Care.com is the world’s leading platform for high-quality family care. The organization used 13-year-old monolithic architecture, so achieving peak performance was challenging. That’s where the engineering team decided to move to microservices. And they didn’t want to encounter performance issues as well. So, Care.com opted for an observability solution.
It helped Care.com to understand the root cause of performance issues. They found that silent mobile push notifications created unnecessary traffic spikes at a specific interval. They also got to know the correlation and impact of this issue on other parts of the system. As a result, MTTR got reduced to 10 minutes from an hour, and developers could release features on time and more frequently.
Here are some of the core characteristics of enterprise observability:
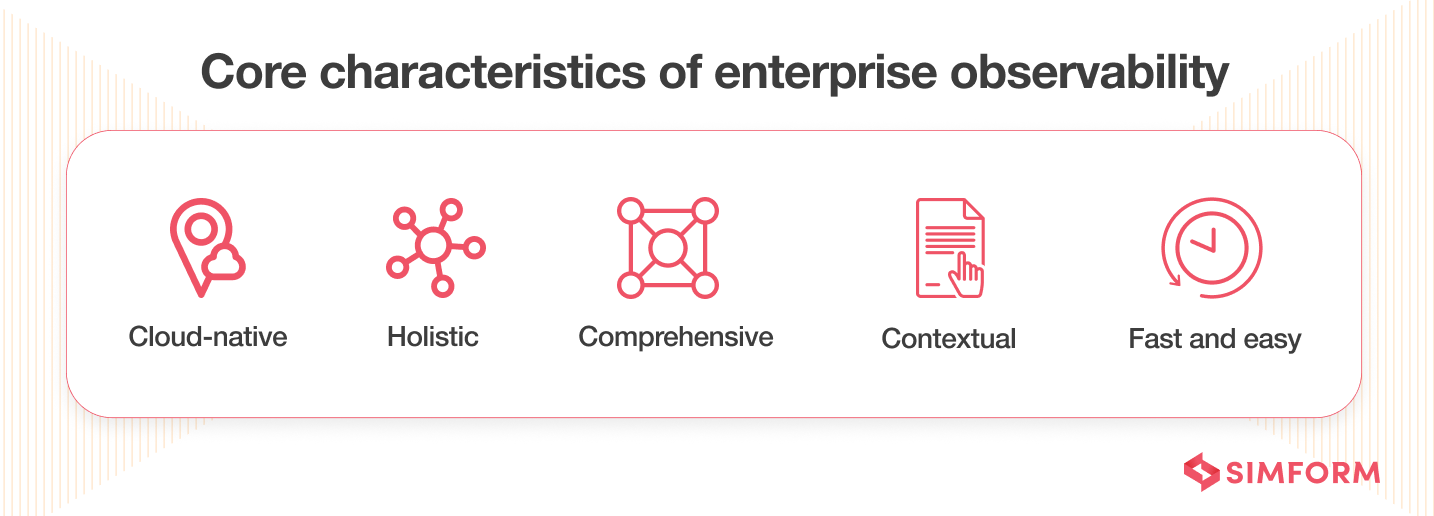
Characteristic 1: It’s cloud-native
Enterprise observability solutions can easily integrate into cloud-native application environments. It can also work with containers, Kubernetes, and microservice architectures.
Characteristic 2: It’s holistic and contextual
By holistic and contextual, we mean it can correlate interactions between various components and helps you contextualize the data collected from multiple sources. It also means you’re not managing individual applications or systems; instead, you’re trying to make the whole IT ecosystem observable. Lastly, you don’t have to decide which data is relevant and in what context. Instead, the tool will provide suggestions in that regard and saves valuable time.
Characteristic 3: It’s comprehensive
The scope of enterprise observability is comprehensive. It covers the CI/CD pipeline from planning to coding, testing, deployment, measurement, and optimization. It can collect all the relevant data existing in the public cloud, private cloud, or the mainframe.
Characteristic 4: It’s fast
Enterprise observability can match the speed of today’s IT environments. Instead of processing data for minutes and hours, these tools focus on every second and provide you with granular details of code changes. It helps you make informed decisions, ultimately allowing you to improve your application performance.
While it’s evident that enterprises can hugely benefit from the core characteristics of observability, let’s go through the primary benefactors of enterprise observability.
Who needs enterprise observability?
- The Development Team: Development teams need enterprise observability solutions to detect and resolve application performance issues quickly. It also helps minimize the product’s time to market, giving it a competitive advantage over others.
- DevOps, SRE, and Support Team: They need enterprise observability solutions to know the root cause of issues in application performance. Based on this data, they can take corrective measures and churn out issues negatively impacting the user experience.
- Application Owners: They want to know the real-time status of the application. With enterprise observability, they know if the app is working well, is available, and quality is maintained over time.
It’s good to know enterprise observability, how it works, its core characteristics, and who needs it. However, as an IT team, if you want to reap the benefits of the enterprise observability concept, you need to build or buy a solution. The follow-up section will enlist factors you must watch out for in an enterprise observability solution.
How adopting cloud infrastructure helped Capital One achieve great success at DevOps implementation
What are 4 factors to consider when choosing an enterprise observability solution?
With so much information available on your platter in the internet age, the challenge is finding the right one. The same applies to the case of enterprise observability, where you have plenty of solutions. However, the challenge is to find the right one that helps you to reap the rewards of enterprise observability.
Here are the four factors you should look for in an enterprise observability tool:
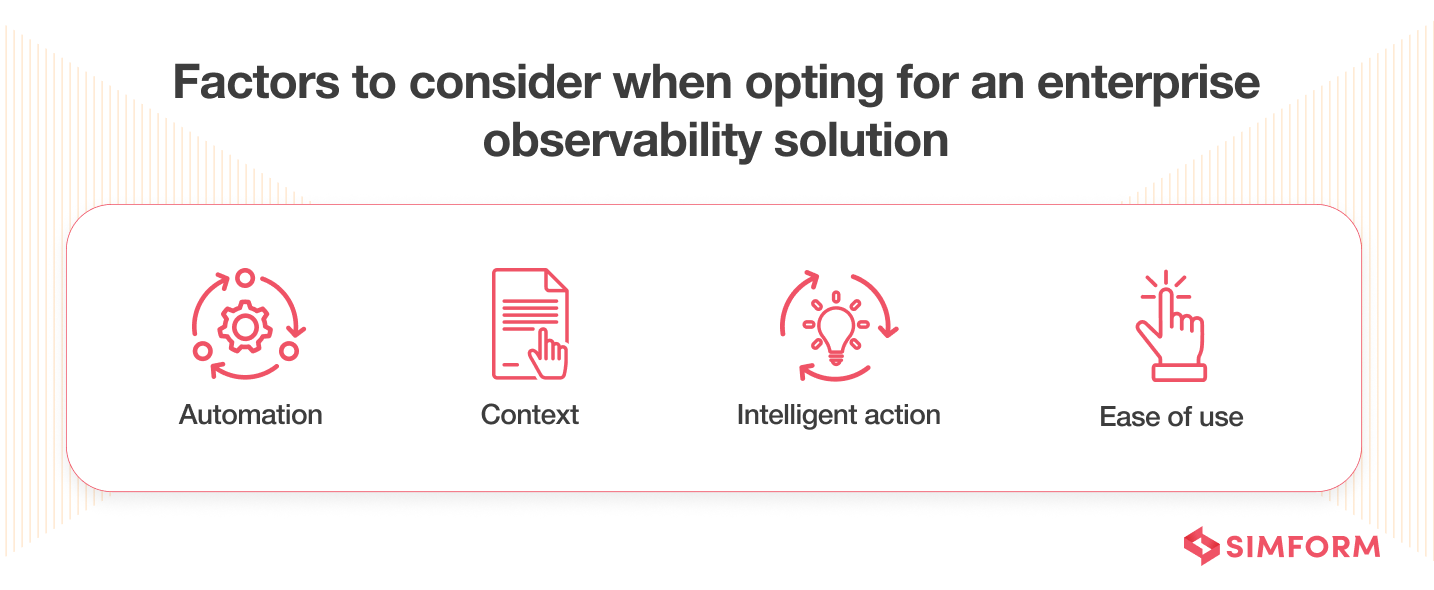
Context
The observability tools should clearly state how different application components work together and which data is relevant. Contextualization of data also means you have a straightforward visual representation of your system based on which IT teams can make informed decisions.
A good observability tool will focus on the dataset that impacts the user experience. IT teams don’t have to spend time finding the context and relevance of the data. This ideal tool would provide you with a unified dashboard of app performance.
Automation
The observability tool should make the job of IT teams easier through automation. IT teams should not need to track and respond to application issues manually. The tool should automate every aspect. This includes discovery, dependency mapping, monitoring, tracing user experience, root cause analysis, and feedback.
A good observability tool provides complete, continuous, automated discovery of new components, services, and dependencies.
Intelligent action
The best tools have a powerful AI-based analytics engine providing unique insights. It also has an AI-assisted root cause analysis system to assist IT teams become proactive rather than reactive.
Intelligent processing of rich and accurate data gives you actionable insights to upkeep enterprise applications’ overall health.
Ease of use
Finally, the observability tool should be easy to use and understand. The tool should be flexible and highly accessible for everyone. It should provide operations teams, site reliability engineers, developers, and application owners with real-time and accurate information.
Knowing APM and observability as separate entities would give you a basic sense of their work. However, a feature-based comparison would provide a more relevant context for monitoring evolution.
Traditional APM vs. enterprise observability
Here are some of the key differences between traditional APM and enterprise observability:
| Feature | Traditional APM | Enterprise Observability |
| Focus | Focuses on user experience | Focuses on application health |
| Primary Data Types | Pulling of state and Synth agents | Pushing of histograms, metrics, logs, and traces |
| Orientation | Reactive | Proactive |
| Alerting Mechanism | Static | Dynamic |
| Primary Incident Scope | Known Unknowns | Unknown Unknowns |
| Suitable For | Legacy applications (Monolith) | Modernized applications (Microservice) |
Want to transit from traditional APM to enterprise observability smoothly?
Enhanced digital experiences are how you win the game. And optimum app performance is key to achieving that. SIMFORM partnered with the global swimming federation to optimize its app performance and create a next-level experience for fans. Their targets were marquee events such as Olympics, Swim Series, and Swimming World Cup. So, managing peak performance through it was a challenge.
Because of end-user interactions, closing the application for maintenance or adding new features was never an option. Our engineering team decided to adopt DevOps and implement CI/CD pipelines. It reduced the app update and deployment time from hours to minutes. We also used observability tools to monitor app performance and could reach the root cause in no time.
To implement enterprise-wide observability to monitor app performance, you need a reliable, experienced, and seasoned technology partner. SIMFORM is one of the top-notch DevOps consulting firms that can help make your IT systems observable by leveraging DevOps principles. Connect with our industry experts and find out how your business can reach new levels of success with observability.
