In 1969, humans landed on the moon through a successful space mission. Some exceptional engineering and a few thousand lines of code made it a reality. The code allowed engineers to monitor spacecraft performance and make accurate real-time decisions. It was a small codebase that allowed engineers to debug it manually.
In the age of distributed computing, there are complex applications with billions of lines of code. Also, there are plenty more components that you need to monitor. And you can’t do it manually. Observability is a proactive approach that makes modern IT systems reliable and high-performing. It helps you measure a system’s internal states by examining its outputs, such as logs, metrics, and traces.
The primary aim of observability is to discover the problem and its root causes. You can look at observability from three different perspectives: infrastructure, data, and machine learning. These perspectives are related to technical personas: DevOps, data, and ML engineers. This article will provide a complete guide on these three perspectives of observability and their nitty-gritty.
What are the Three Types of Observability?
Observability across enterprises can be broken down into three domains— DevOps, data, and machine learning. The difference lies in how engineers use observability to solve unique problems in these respective areas.
There are three types of observability:
Infrastructure/System observability: It deals with software problems, mainly latency, failures, and resource utilization. SREs (Software Reliability Engineers), DevOps engineers, and IT support teams use it to meet their goals.
Data observability: It’s the ability to understand, diagnose, and manage data health throughout the data lifecycle. Data and analytics engineers are responsible for building and operating data pipelines at this level. They ensure the data’s timeliness, completeness, and other quality characteristics.
ML observability: It focuses on the performance of models, measuring how well they can predict system failures. Machine learning engineers and data scientists use ML observability to understand the model across its development phases better.
System observability: Full-stack visibility inside infrastructure
Infrastructure/system observability is the ability to measure the current state of the IT ecosystem based on data points it generates in the form of logs, metrics, and traces.
With the help of observability, software engineers can:
- Monitor distributed IT systems efficiently
- Have full-stack visibility into infrastructure
- Find cascading effects in a complex system
- Conduct root cause analysis with utmost precision
Key facets of infrastructure observability
The following factors are responsible for any proper observability implementation.
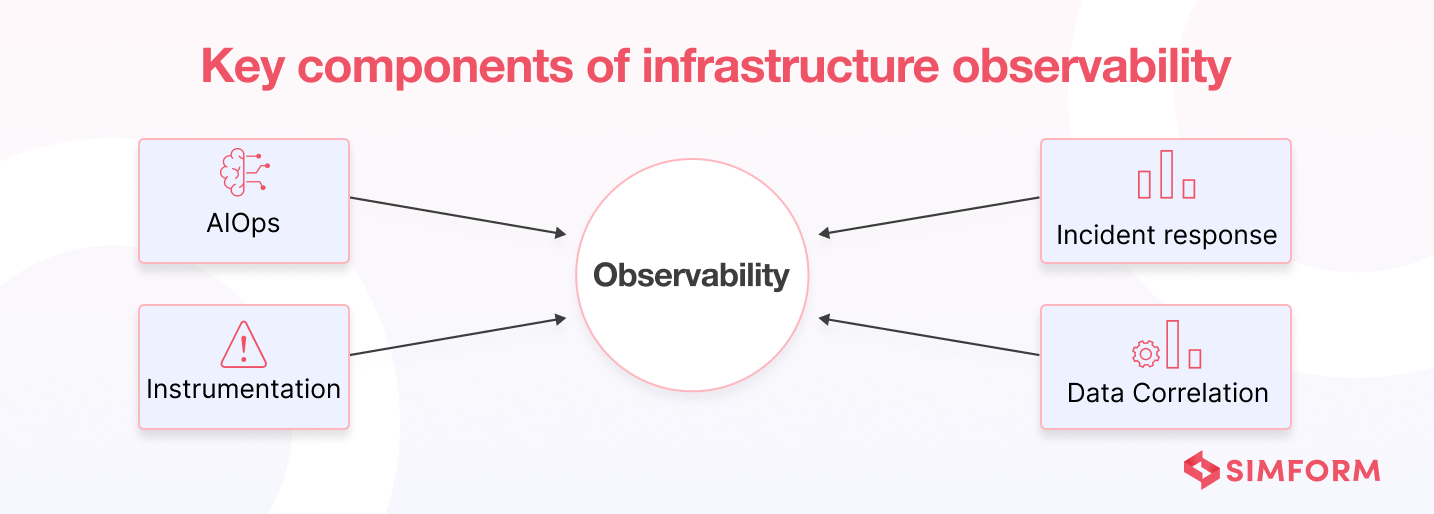
- Instrumentation: These are measuring tools that help you collect telemetry data from various sources, such as containers, services, applications, hosts, pods, etc.
- Data correlation: The system correlates the telemetry data to provide context. It also enables automated data curation for time series visualizations.
- Incident response: It focuses on delivering information about data outages to correct people. For this purpose, they consider technical skills.
- AIOps: Machine learning models aggregate, correlate, and prioritize incident data. They also filter out the alert noise and detect IT system performance issues.
Benefits of infrastructure observability
- Better visibility into IT infrastructure
- Accelerated developer velocity
- Streamlining of application of workflow
- Faster detection of problems
- Pinpoint accuracy in root cause analysis
- Improvement of user experience
Challenges of infrastructure observability
- The complexity of dynamic cloud environments
- Volume, velocity, and variety of alerts
- Monitoring of microservices and containers in real-time
- Quantifying the business impact of observability
Best practices for infrastructure observability
- Monitor things that are highly essential
- Create customized graphs according to customer needs
- Filter data close to the point of creation
- Emphasize data aggregation and centralization
- Put an effective feedback loop mechanism in place
Top infrastructure observability tools
There are many infrastructure observability tools available in the market that follows the best practices mentioned above. Let’s go through some of the tools and their pros and cons.
| Tools | Pros | Cons |
| Grafana | – Visualizes metrics from major cloud providers – Plenty of integrations |
– No data collection and storage facility – Limited data type visualizations |
| Dynatrace | – Accessible customer support – AI-driven analytics and dashboard |
– Lack of documentation – Complex implementation process |
| Datadog | – Easy to set up and configure – Powerful and customizable UI |
– Scaling is a massive challenge – Complex log ingestion and indexing |
| AppDynamics | – Full visibility into data processes – Accurate root cause analysis |
– Steep learning curve – Expensive |
| Splunk | – Full stack support – Highly extensible and scalable |
– User interface requires refinement – Steep learning curve |
| New Relic | – Faster query processing – Real-time reporting |
– Navigation is clumsy – Lack of proper documentation |
| Honeycomb | – Plenty of documentation and tutorials – Automatic detection of outliers |
– Extremely clunky user interface – Lack of traditional monitoring capabilities |
| Lightstep | – Dynamic sampling technique – Highly intuitive user-interface |
– Still many features are in a nascent stage – Slow data processing |
Ensuring reliable application performance with infrastructure observability
The Seven Network ensured 100% uptime and flawless viewing experience with an infrastructure observability solution
The Seven Network, or Channel 7, is Australia’s no.1 free-to-air television network. It held the right to AFL Grand Final, the 2020 Tokyo Olympics, and the 2022 Winter Olympics. Ensuring a smooth viewing experience during the live telecast of such high-traffic events is a massive challenge. To counter this, Channel 7 implemented an infrastructure observability solution. With observability in place right from proof of concept, it assured reliable delivery.
The observability solution captured valuable data at the application level. It also could monitor lightweight container and orchestration services. The solution correlates issues between AWS servers and app performance. It helped Channel 7 to detect infrastructure-level bottlenecks before they impacted the user experience. They maintained 100% uptime and a flawless viewing experience for the fans.
Lenevo E-Commerce ensured 100% uptime and reduced MTTR by 80% with an infrastructure observability solution
Lenevo is a $50 billion multinational organization that designs and manufactures intelligent devices. The company has a robust e-commerce marketplace. For any e-commerce platform, continuous uptime is a challenge, directly affecting the shopping experience. Lenovo used an infrastructure observability solution to allow its developer full-stack visibility inside the infrastructure.
It helped Lenevo engineers to respond swiftly to customer issues. The faster troubleshooting mechanism helped them reduce the MTTR from 30 to 5 minutes. The observability solution also ensured zero dropped transactions, zero performance hiccups, no delays, and real-time visibility into every transaction. Even during the peaks of Black Friday/Cyber Monday, Lenevo ensured 100% uptime, thereby providing a seamless and reliable user experience to shoppers.
Data observability: Full-stack visibility inside data pipelines
Data observability is an organization’s ability to understand, diagnose, and manage data health in an IT system. It eliminates data downtime by applying the best practices for managing data pipelines.
The data observability solutions use automated monitoring/alerting to evaluate data quality and discoverability issues. It leads to healthy data pipelines, productive teams, and happy customers.
Key components of data observability
There are five significant pillars or elements of data observability.
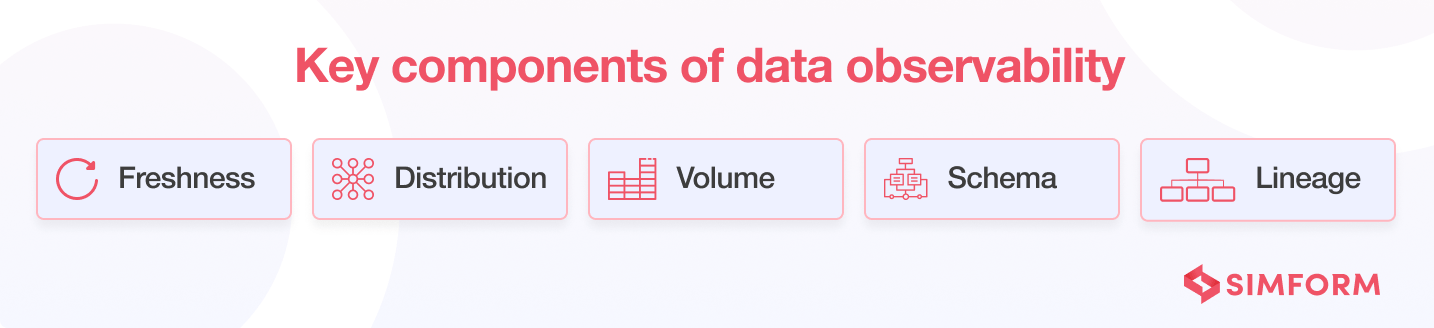
- Freshness: Ensuring all the data in the system is up-to-date is one of the biggest challenges of modern IT systems. Data freshness helps you to know whether your data tables are up-to-date. It also helps you in decision-making, as stale data can lead to bad decisions with heavy consequences.
- Distribution: Data accuracy is paramount for building a reliable data system. Data distribution tells you about the variance of data in the system. If there’s too much variance, there’s an issue with accuracy. Data distribution focuses on the quality/consistency of data produced/consumed by the system.
- Volume: Data volume aims to answer if the incoming data is within the defined threshold limit or if there is enough storage space to meet data demands. Keeping continuous track of volume ensures data requirements are within defined limits.
- Schema: As any organization grows and new features get added to the application database, there will be changes in the schema. Schema ensures that data tables, fields, columns, and names are accurate, up-to-date, and regularly audited.
- Lineage: Lineage refers to the ability to trace the flow of data right through the data systems. It combines the other four pillars to present a complete picture of your data ecosystem. You can have a blueprint of your data system with the help of data lineage.
Benefits of data observability
- Detect data issues before they affect the business
- Ensure timely delivery of quality data
- Accelerate time-to-market
- Facilitates greater operational efficiency
- Improve collaboration among data engineers
- Ensure consistency of data in IT systems
Challenges of data observability
- Continuous growth in the volume of data as a business expands
- Complex data pipelines with constant changes
- Break down of data silos within IT systems
- Integration of all systems across the organization
- Standardization of data coming from various sources
Best practices for data observability
- Try to collect real-time data from various sources
- Integrate data monitoring solutions with every workflow
- Turn on data logging wherever required
- Deliver actionable data results to the stakeholders
- Bring automated remediation systems wherever possible
Top data observability tools
There is a vast amount of data observability tools. However, choosing the right one for your application can be tricky. Here are a few popular data observability tools.
| Tools | Pros | Cons |
| Monte Carlo | – Automated root cause discovery – Easy to setup and configure |
– Lack of proper documentation – User interface requires refinement |
| Acceldata | – Automated data reliability – Predicts operational issues |
– Lack of customization – Node addition/removal requires human intervention |
| Amazon Cloudwatch | – Easy to set up alarms – No need for setup or maintenance |
– Complex user interface – Scaling is very costly |
| Elastic Observability | – Scale both horizontally and vertically – Easy to understand and deploy |
– Lacks predictive analytics capability – Steep learning curve |
| Databand | – Discovers broken data pipeline – Plugs into various cloud-native tools |
– Expensive – Suitable only for ML-based projects |
| Datafold | – Creates intelligent alerts from SQL queries – Facilitates monitoring of ETL changes |
– Relatively immature tool – Setup process is lengthy |
Ensuring efficient utilization of resources and reducing infrastructure costs with data observability
Hotjar reduced infrastructure costs by 3x with data observability
Hotjar is one of the leading global product experience insights companies that deal with native and third-party data. The reliability of data pipelines is among the most important things for them. Earlier, Hotjar relied on dbt for testing, which created issues with alerting delays. Then Hotjar decided to opt for an end-to-end data observability solution.
On 1st July 2021, data observability warned Hotjar of unusual traffic. Hotjar used to have 20,000 events per day but reached 400k that day. It was half of their monthly tracked user (MTU) usage. First, Hotjar engineers used a data incident management tool to find the problem area. They discovered that the unusual traffic was taking 80% of their MTU capacity, which meant it was the problem area. After that, engineers used an end-to-end lineage tool that tracked down the root cause of this unusual traffic. It helped Hotjar conduct more efficient resource utilization and reduce its infrastructure cost by 3x.
PhonePe reduced data management costs by 65% and scaled the data infrastructure by 2000% with data observability
PhonePe is a popular payment service provider in India. As the product embarked on the journey of massive expansion, the data team found it harder to maintain system performance. They had to tackle many issues and identify their root causes, resulting in unnecessary downtime. PhonePe’s OLTP (online transaction processing) and OLAP (online analytical processing) are incredibly complex and need a comprehensive solution.
PhonePe then opted for an end-to-end data observability solution. It helped them to monitor HBase, Spark, and Kafka pipelines to distinguish various anomalies. It also assisted them in scaling the data infrastructure from 70 to 1500 nodes, a 2000% growth. With accurate root cause analysis and an automated alerting mechanism, PhonePe reduced data management costs by 65% and ensured rapid growth.
Machine Learning (ML) observability: Full-stack visibility inside training models
Machine Learning (ML) observability is obtaining a deep understanding of your training model and performance across the software development lifecycle.
Key components of ML observability
Machine Learning (ML) observability requires you to focus on four principal components for correct implementation.
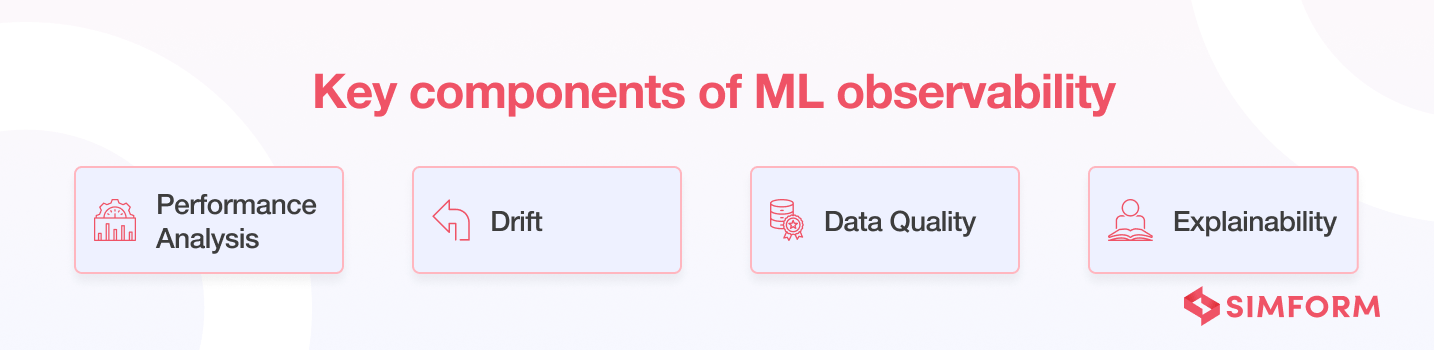
- Performance analysis: It ensures that the performance of the ML models stays more or less the same as what it was at the time of training or when promoted to production.
- Drift: It helps you to know if your models have grown stale, if you have data quality issues, or if there are adversarial inputs in your model. Detecting drift in the models helps you to protect them from performance degradation.
- Data quality: It identifies hard failures within data pipelines between training and production that affect system performance. Data quality involves monitoring missing data, data type mismatch, and more to better gauge model performance.
- Explainability: It uncovers training, validation, and production features that can explain why the model works a certain way. You can measure it by calculating metrics like SHAP and LIME.
Best practices for ML observability
- Include ML observability from the experiment stage
- Ensure accountability of data and models
- Process batch and streaming data similarly for better troubleshooting
- Continuously monitor your machine learning data models
- Keep an eye on the accuracy of your predictions
- Log everything critical to system performance
Top ML observability tools
Let’s go through some of the top ML observability tools that you might find helpful.
| Tools | Pros | Cons |
| Neptune | – Logs any model metadata from anywhere in the ML pipeline – Allows you to build customized dashboards |
– UI needs a bit of improvement – Not much focus on model input/output distribution |
| Arize | – Automated model monitoring – Pre-launch model validation |
– Lack of multi-lingual support – No integrations with third-party tools |
| WhyLabs | – In-built data debugging tool – Easy to set up |
– Can’t monitor CI/CD pipelines – Can’t monitor hardware-level metrics |
| Evidently | – Generates interactive reports – Analyzes ML models during all stages |
– Lack of API integrations – Very few visualization options |
| Qualdo | – Provides integrations with many AI tools – Automatic monitoring of data drift |
– Lack of advanced-level capabilities – Steep learning curve |
| Amazon Sagemaker | – Accelerated data processing – Kubernetes integration for container deployments |
– Platform lags a bit when processing vast amounts of data – Understanding training modules for beginners can be overwhelming |
Ensuring higher ROI and reducing operational costs with ML observability
ShareChat increased its ROI by 100% and decreased the time for error detection
ShareChat is a rapidly-growing social media unicorn with 400 million monthly active users. The engineering team at ShareChat relies on 100+ machine learning models for various use cases like advertising, feed management, content intelligence, etc. Managing 100+ ML models took most of the organization’s productive time. The engineers were busy dealing with monitoring issues. ShareChat opted for ML observability to free up its engineers for more productive tasks.
With ML observability, the time for error detection became a few minutes from 24 hours. Hundreds of productive hours freed up, reducing the overall operational cost. It also allowed ShareChat to utilize those hours productively, resulting in an increase of 100% in the ROI.
Clevercover increased its ROI by 150% and freed up 400+ productive hours with ML observability
Clevercover is a tech-driven car insurance company that promises exceptional coverage. It developed a team of 10+ ML practitioners and data scientists. They developed ML models for marketing, customer retention programs, and unified customer experience. Initially, Clevercover used BI tools to examine ML models that took more than two weeks to set up the dashboard and 9-10 weeks/per year for monitoring. Also, there was a 24-hour delay in issue tracking.
To overcome these challenges, Clevercover used ML observability. It enabled automated monitoring of ML models and real-time alerts for significant issues. It also implemented a data integrity mechanism and accurate root cause analysis. These changes freed up 400+ productive hours for engineers, which directly affected the operational costs. The engineers used this time in critical business decisions that helped them increase ROI by 150%.
These are the three types of observability that your IT ecosystem needs. And all of them are essential for your business. It all boils down to business objectives you want to achieve and the software layer at which you want to work.
Infrastructure vs. data vs. machine learning observability
Here’s how the three observability types differ from each other:
| Parameter | Infrastructure Observability | Data Observability | ML Observability |
| Beneficiaries | DevOps engineers, IT support team, and SRE | Data and analytics engineers | ML practitioners and data scientists |
| Purpose | Reduce app downtime | Reduce data downtime | Redue drift of ML models |
| Monitoring Parameters | Logs, metrics, traces | Data volume, freshness, schema, distribution | Accuracy, recall, precision, F1 Score, MAE, RMSE |
| Root Cause Analysis Through | Service maps | Data lineage | Performance tracing |
| Use Cases | Application monitoring, DevOps, Platform security | Data monitoring, Data quality, Data adoption, Data trust, Data discovery | ML model failure analysis, Data and performance deviation analysis, Explainability |
| Popular Tools | Grafana, Dynatrace, Datadog, AppDynamics, Splunk, New Relic Honeycomb, Lightstep | Monte Carlo, Acceldata, Amazon Cloudwatch, Elastic Observability, Databand, Datafold | Neptune, Arize, WhyLabs, Evidently, Qualdo, Amazon Sagemaker |
How to Make Your Modernized IT Systems Observable?
Observability is an essential quality for modern IT systems. However, it doesn’t come that easily. We collaborated with an auto dealer to build data driven-marketing and analytics platform. As 1000+ car dealers were using the platform, there was a need to monitor the performance and reliability of software constantly. Our engineers use serverless architecture to build the marketing automation platform. And we used infrastructure observability to keep track of software performance and reliability in the distributed environment.
Specifically, we focused on capturing logs, traces, metrics like MTTR, system uptime, response time, the number of requests per second, etc. It allowed us full-stack visibility over the serverless infrastructure and identified performance bottlenecks. It also helped us know the issues in real-time with alerting mechanism. With such experience and knowledge in DevOps, SIMFORM is your one-stop solution. We’re one of the leading DevOps consulting firms that help you make your IT systems observable through DevOps principles to accelerate the release cycle. Collaborate with our engineering team and avail a solution that creates digital transformation for your business.
