Cloud bills increase for one of two reasons: because business is scaling effectively or your systems are spending inefficiently. The tricky part? They look exactly the same on paper.
So, what do your cloud costs really tell you, and how can you distinguish between growth and waste?
Growth Signal #1: Your cloud costs are rising but so is your business value
Cloud spend should rise but it should rise with revenue, product usage, or customer engagement.
You can benchmark this through Cloud Efficiency Rate (CER) – the percentage of revenue that goes to the cloud. Highly efficient organizations operate with a CER of 92% or better, meaning they spend only $0.08 per $1 of revenue on cloud.
What to look for:
CER above 90%: If CER is improving as revenue grows, your architecture is contributing to margin.
Stable or falling unit cost (per user, per 1,000 requests): If usage is climbing and unit cost isn’t, you’re optimizing with scale.
Spend/value timing: If spend increases are driven by user growth or product success – not preceding them – it’s healthy growth.
Growth Signal #2: Cloud usage stretches elastically, not statically
Cloud is supposed to be elastic. But if you’re only scaling up and never back down, you’re just replacing fixed costs with flexible waste.
When demand spikes and your spend goes up? Good.
When demand drops and your costs stay flat? Not so good.
What to look for?
Scaling patterns that mirror traffic: Peaks and dips in infrastructure usage should match actual usage patterns.
Downscaling events: Frequent reductions in node count, container instances, or DB capacity suggest elasticity is working.
Infra that shrinks during idle hours: If usage doesn’t taper during nights/weekends (especially for dev/test), you’re likely carrying unnecessary cost.
Stay updated with Simform’s weekly insights.
Growth Signal #3: Efficiency improves even as the scale explodes
Most companies experience CER degradation as they scale, particularly when engineering headcount increases. But elite teams reverse that trend through workload reshaping, memory tuning, and architectural redesigns that reduce cost per operation even under rising traffic
Real engineering maturity means your infrastructure performs better as it gets busier.
What to look for:
Throughput per dollar: It’s a growth signal if you support more transactions/users/requests without growing your footprint.
System performance trends: Lower latency or reduced processing time under growing load signals high return on infra.
Flattening infrastructure curves: If infra scale slows while business usage rises, it’s a sign that optimization is compounding.
Waste Signal #1: Your costs are centralized, but decisions are distributed
As teams ship faster and infra becomes more abstracted, cloud spend is increasingly owned in usage, but not in accountability.
Some organizations do hold engineering accountable for cloud spend, yet most do so without shared visibility or cost feedback loops. This mismatch is hard to detect from individual line items, but shows up in how decisions get made.
What to look for:
Infra usage that scales faster than team accountability: If new services appear in your bill but don’t have a team behind them, they’ll likely stay until someone else pays the price.
No internal showback or chargeback models: Centralized billing without team-level visibility removes the feedback loop that drives optimization.
Cloud cost decisions happening post-spend: If you’re reviewing cost after infra is deployed – not before – decisions are being made blind.
Waste Signal #2: Commitments are growing, but coverage isn’t improving
On paper, your commitment spend is increasing – more Reserved Instances, Savings Plans, or Committed Use Discounts. But your on-demand costs haven’t dropped, and your discount coverage hasn’t improved. That’s not optimization. That’s misalignment.
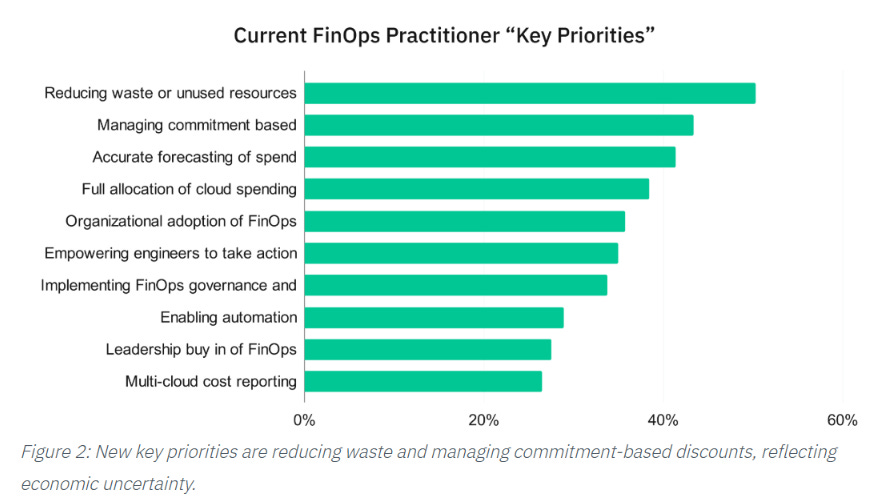
FinOps data shows that commitment-based discounting is now the #2 priority, especially for larger cloud spenders. But many still struggle to connect commitments to real workload patterns, especially as usage shifts faster than forecasts.

What to look for:
Flat discount coverage despite rising commitment spend: If you’re buying more but saving less, your planning loop needs tuning.
Commitments concentrated in static teams or services: Dynamic workloads often get left out.
Delayed or inaccurate forecasting inputs: If engineering and finance aren’t forecasting together, commitments are reduced to just being financial artifacts.
Waste Signal #3: Rising operational cost (people/process drag)
As cloud operations grow, so does the cost of managing them. And when that cost grows faster than your ability to act, it becomes a form of hidden waste.
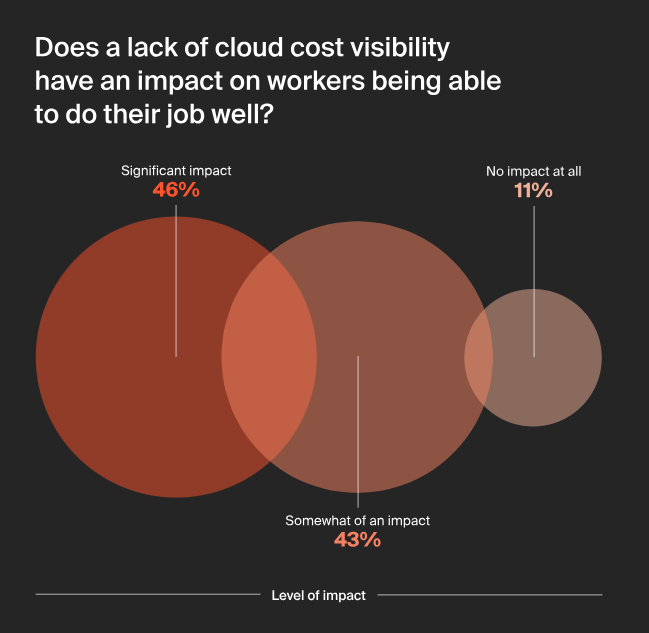
Two-thirds of companies in a survey said cost investigations disrupt their work, and 89% of orgs report that poor cost visibility limits team performance. Many organizations respond by adding more dashboards and reporting layers; but without better alignment, those layers just end up becoming blockers.

What to look for:
Recurring time-to-diagnosis gaps: If it takes days to explain a spike, your tooling may be accurate but not useful.
Sprint disruptions due to surprise bills or anomalies: When cost issues consistently land mid-cycle, your feedback loop is too slow.
Decisions delayed by cost uncertainty: If teams are avoiding infra changes or scaling plans because “we don’t know what it will cost,” remember that you are paying in opportunity by trying to save the dollars.
Even if you’re not the one managing cloud costs, you can shape how your team interprets them. Start by bringing one of these signals into your next planning or review conversation. Cost clarity is a shared responsibility and it becomes a competitive advantage when it works.
